

Track the carbon intensity of the GB electricity grid on your iPhone or iPad
Demand for electricity varies throughout the day, and thus, the mix of generators supplying this electricity continually changes. As a result, the carbon intensity of the electricity – the quantity of CO2 produced for 1 kWh of electricity consumed – also varies continually. Deferring your use of electricity to off-peak times, when the carbon intensity is low, can help reduce your carbon footprint.
Features:
- Data updated every 5 minutes.
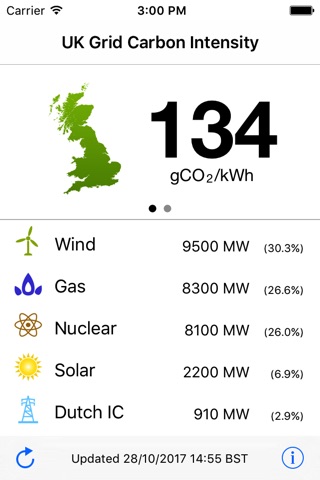
- Display of instantaneous carbon intensity (gCO2/kWh).
- Traffic light indicator to highlight period of low and high carbon intensity.
- Generation mix summary showing total and percentage supply by type.
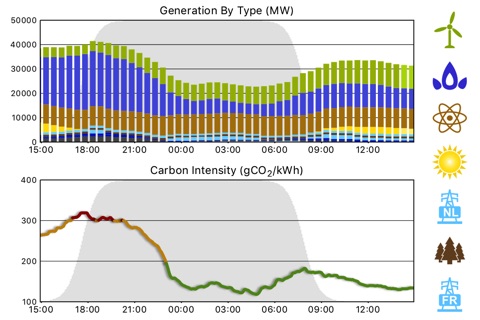
- Line plot showing carbon intensity over the previous 24 hours.
- Interactive bar chart showing the generation mix over the previous 24 hours.